professional tube testing system (c) Helmut Weigl |
|---|
| Kennlinie im Zeitverlauf - Characteristic curve over time Die neue Funktion ermöglicht den Anodenstrom der Röhre im Zeitverlauf aufzunehmen. Hier kann man schön ersehen, wie lange es dauert, bis die Röhre die volle Leistung entwickelt. Auch lassen sich schlechte Röhren erkennen, bei denen der Anodenstrom sehr lange braucht, bei denen der Anodenstrom nach einiger zeit sogar wieder fällt, oder Röhren, die mit der Zeit davonlaufen. This new function allows to record the anode current of a tube over time. Here you can see nicely how long it takes until the tube develops its full power. Also bad tubes can be recognized that have an anode current that takes a long time to develop or even drops after some time; also tubes that go astray with time can be recognized. 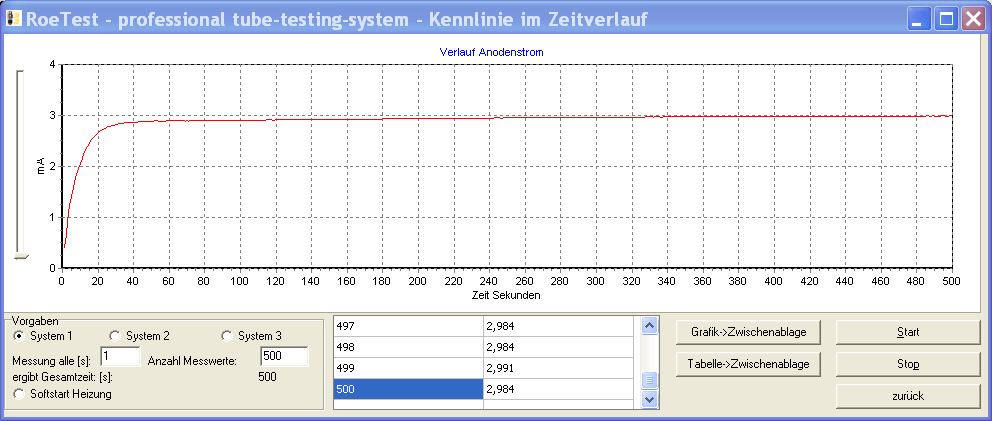 Beispielmessung: EF804 Example: measurement of an EF804 Das Interval (wie oft eine Messung erfolgen soll) ist von 1- 99 Sekunden einstellbar. Daneben kann die Anzahl der Messwerte festgelegt werden. Vorgabe ist 1 Messung pro Sekunde und 500 Messungen (Gesamtzeit etwas über 8 Minuten). Man kann die Messung auch früher abbrechen. Mit dem Schieberegler auf der linken Seite der Grafik kann man die Y-Achse anpassen, so dass die Kennlinie gut abgelesen werden kann. Die Grafik und auch auch die Wertetabelle können mit den Button in die Windows-Zwischenablage übertragen werden. The interval (how often a measurement will be made) can be adjusted from 1-99 seconds. Also the number of measurement values can be defined. Defaults are 1 measurement per second and 500 measurements (total time somewhat above 8 minutes). It is possible to stop the measuring earlier. The slider on the left hand side of the graphics can be used to adjust the Y-axis so that the characteristic curve can be read easily. The graphics and the value table can be transferred to the Windows clipboard using the button. |